Note
Click here to download the full example code
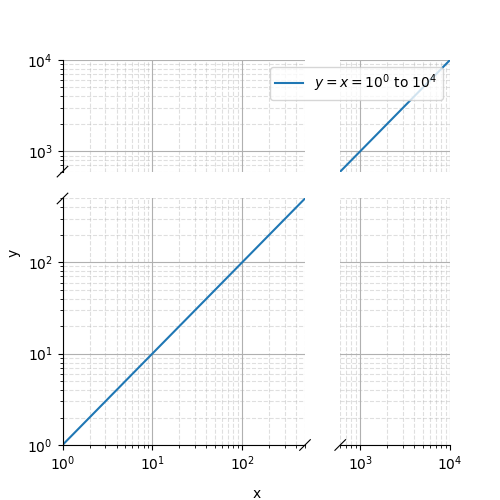
Log scales
Brokenaxe compute automatically the correct layout for a 1:1 scale. However, for logarithmic scales, the 1:1 scale has to be adapted. This is done via the yscale or xscale arguments.
import matplotlib.pyplot as plt
from brokenaxes import brokenaxes
import numpy as np

fig = plt.figure(figsize=(5,5))
bax = brokenaxes(xlims=((1, 500), (600, 10000)),
         ylims=((1, 500), (600, 10000)),
             hspace=.15, xscale='log', yscale='log')

x = np.logspace(0.0, 4, 100)
bax.loglog(x, x, label='$y=x=10^{0}$ to $10^{4}$')

bax.legend(loc='best')
bax.grid(axis='both', which='major', ls='-')
bax.grid(axis='both', which='minor', ls='--', alpha=0.4)
bax.set_xlabel('x')
bax.set_ylabel('y')
plt.show()
Total running time of the script: ( 1 minutes 8.214 seconds)