Note
Click here to download the full example code
Basic usage
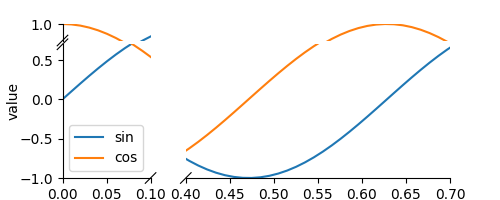
This example presents the basic usage of brokenaxes
import matplotlib.pyplot as plt
from brokenaxes import brokenaxes
import numpy as np

fig = plt.figure(figsize=(5,2))
bax = brokenaxes(xlims=((0, .1), (.4, .7)), ylims=((-1, .7), (.79, 1)), hspace=.05)
x = np.linspace(0, 1, 100)
bax.plot(x, np.sin(10 * x), label='sin')
bax.plot(x, np.cos(10 * x), label='cos')
bax.legend(loc=3)
bax.set_xlabel('time')
bax.set_ylabel('value')
Total running time of the script: ( 0 minutes 12.282 seconds)