Note
Click here to download the full example code
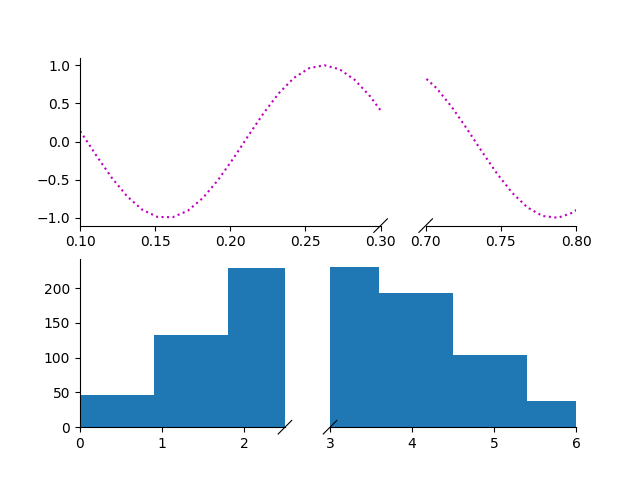
Handle subplots with brokenaxes
If you want to use subplots together with brokenaxes, you have to use GridSpec.
from brokenaxes import brokenaxes
from matplotlib.gridspec import GridSpec
import numpy as np

sps1, sps2 = GridSpec(2,1)

bax = brokenaxes(xlims=((.1, .3),(.7, .8)), subplot_spec=sps1)
x = np.linspace(0, 1, 100)
bax.plot(x, np.sin(x*30), ls=':', color='m')

x = np.random.poisson(3, 1000)
bax = brokenaxes(xlims=((0, 2.5), (3, 6)), subplot_spec=sps2)
bax.hist(x, histtype='bar')
Total running time of the script: ( 0 minutes 8.709 seconds)